Unhealthy statistics: fewer Americans have health insurance — and millions are not sharing in economic growth
Editor’s note: The Coalition on Human Needs issued the following news release Tuesday, after the release of new U.S. Census Bureau statistics detailing the levels of income, poverty and health care coverage.
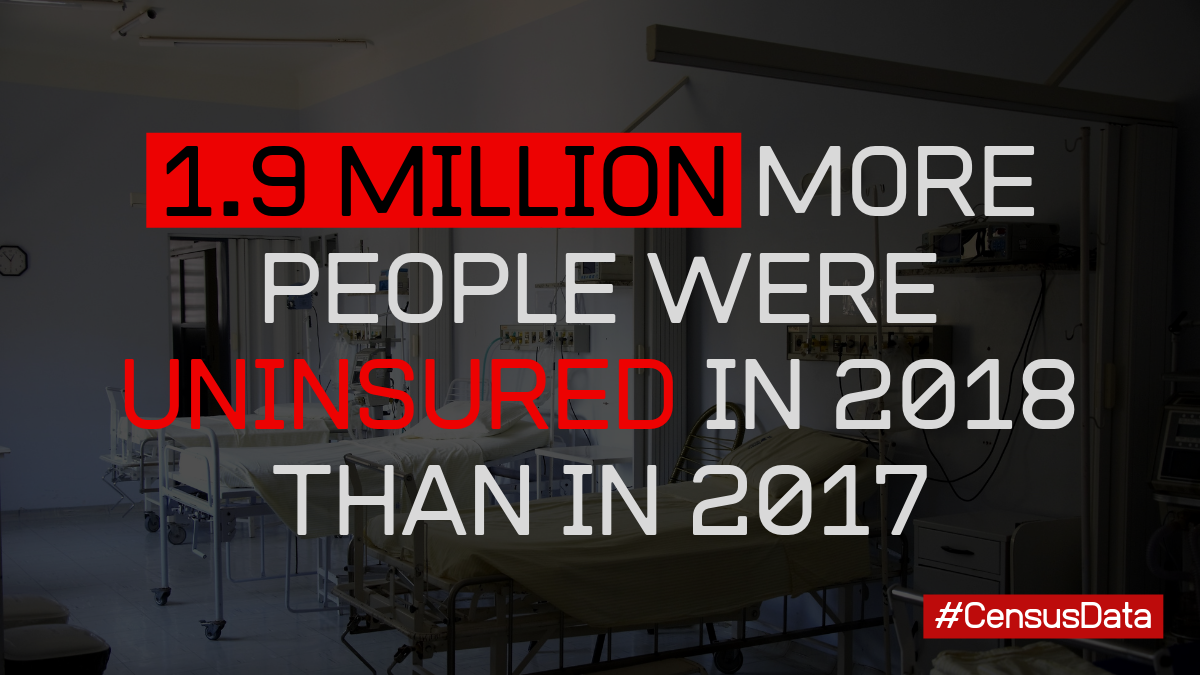
For the first time since implementation of the Affordable Care Act, the number of uninsured Americans has risen – evidence of the Trump Administration’s assault on health care. U.S. Census Bureau statistics released Tuesday show 27.5 million Americans, or 8.5 percent of the population, did not have health insurance in 2018, an increase of 1.9 million over 2017.
“The Affordable Care Act has helped millions of Americans achieve coverage, and now, for the first time since that historic accomplishment, we are going backwards,” said Deborah Weinstein, Executive Director of the Coalition on Human Needs. “This is tragic and inexcusable. What’s even worse is that the Trump Administration is trying to overturn the entire ACA and deny coverage to people with preexisting conditions, while working hard to sabotage Medicaid coverage.”
Medicaid coverage dropped by nearly 2 million people from 2017 to 2018. Those losing Medicaid did not shift to private insurance; there were 429,000 fewer private insurance enrollees in 2018 than in 2017.
The income and poverty findings showed a nation with median income stalled ($63,200 in 2018, not statistically different from the previous year), and with more than half of the nation’s income held by the richest 20 percent. The most accurate measure of poverty showed no one-year decline. The Supplemental Poverty Measure, which takes into account housing and other costs as well as counting income from sources such as SNAP/food stamps and low-income tax credits, showed a 13.1 percent poverty rate, higher than the official poverty rate of 11.8 percent. It is telling that the more accurate measure also shows more poverty. Why? Major expenses like rent are growing faster than overall inflation. From 2017 to 2018, rent costs rose by 3.5 percent, while the overall inflation rate was 1.9 percent. This continues a trend: from 2013 – 2018, rent rose nearly 20 percent, while inflation as a whole rose 7.8 percent.
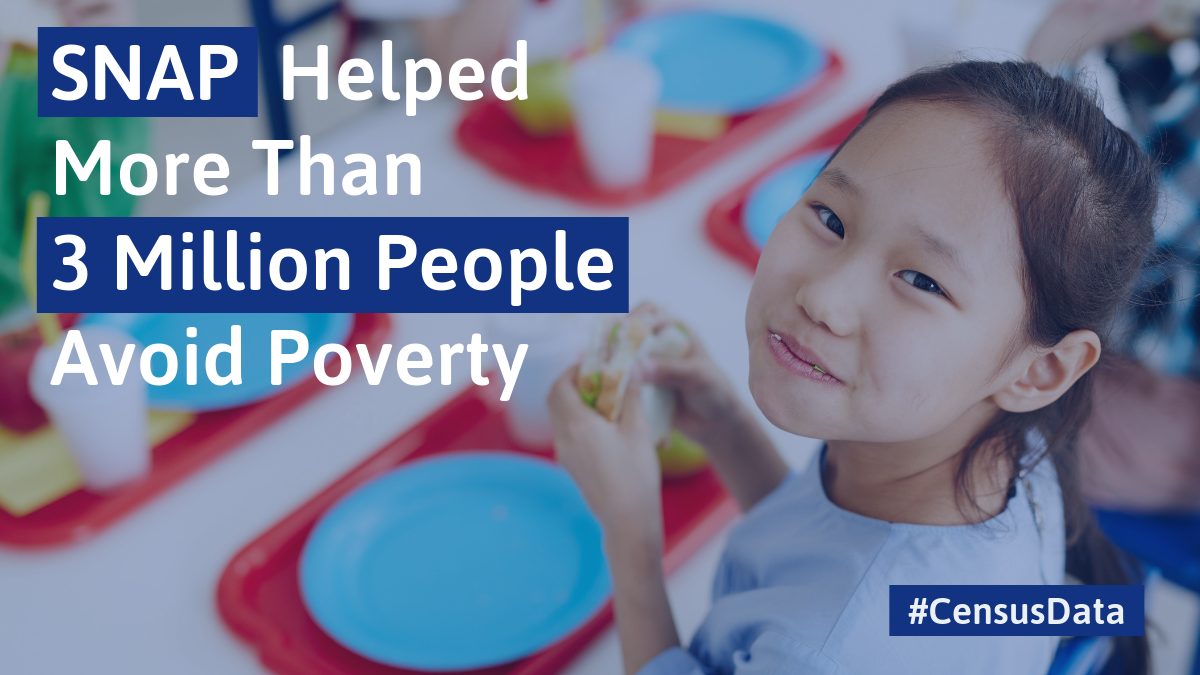
“When people get help from government programs like Social Security, low-income tax credits, SNAP/food stamps or housing assistance, millions are lifted out of poverty,” said Weinstein. “But the Trump Administration is trying to cut SNAP, housing aid, and many other programs that can help families escape poverty.” The Supplemental Poverty Measure data show that Social Security continues to be the most important anti-poverty program, moving 27.3 million Americans out of poverty. Refundable tax credits moved 7.9 million people out of poverty, SNAP/food stamps moved 3.1 million out of poverty, housing assistance, 3 million people, and SSI, 2.9 million people.
“More than 93 million Americans are living on the edge (nearly 29 percent), with incomes up to twice the poverty line, but not high enough to withstand rising rent, health care, and other basic costs,” said Weinstein. (A family of four up to twice the poverty line would have an income lower than $51,400.)
She cited a May 2019 Federal Reserve report that found that one-fourth of all adults reported skipping “necessary” medical care because they couldn’t afford the cost; three in ten adults can’t count on the same level of income from month to month; and more than one-third of adults are unprepared to deal with an emergency expense of $400 or more.
Weinstein noted that race plays a disproportionate impact on who is poor and who is not. Among non-Hispanic Whites, the poverty rate in 2018 was 8.1 percent; among Blacks, it was 20.8 percent; and among Hispanics (any race) it was 17.6 percent. The poverty rate for non-Hispanic Whites declined from 8.5 percent in 2017 to 8.1 percent in 2018 while the poverty rate for Blacks, Asians and Hispanics did not change significantly from the previous year. And children remain disproportionately poor: 16.2 percent of children under the age of 18 lived in poverty in 2018, down 1.2 percentage points from 2017. 8.9 percent of non-Hispanic White children live in poverty, compared with 29.5 percent of Black and 23.7 percent of Hispanic (any race) children.
The statistics revealed a significant disparity in the number of uninsured Americans in states that did not expand Medicaid compared with the number of uninsured Americans in the states that did. In states that did expand Medicaid, the average uninsured rate was 6.6 percent; in states that did not expand Medicaid, the average uninsured rate was almost double, at 12.4 percent. “Medicaid’s success in reaching Americans who need it is all the more reason why more states should expand Medicaid, and Congress should do everything in its power to resist the Trump Administration’s attempts to dismantle Medicaid and the ACA,” Weinstein said.
Editor’s note: Click here to view CHN’s “First Look at Poverty and Health Insurance: Fewer Americans Have Health Insurance – And Millions Are Not Sharing in Economic Growth.
Subscribe: