



What the Public Really Thinks About Basic Needs Programs
Some policymakers have made fraud claims central to its push to cut federal funding for basic needs programs. But what do voters actually think? Hart Research conducted a national survey of 1,503 registered voters in March 2026 for the Partnership for Basic Needs, and the findings are clear: support for Medicaid, SNAP, childcare, housing, and other programs remains strong and unmoved even after a year of exaggerated attacks by the Trump administration. By almost 2 to 1, voters are more concerned that basic needs program cuts will hurt vulnerable people than they are that so-called “fraud” and abuse are being “tolerated” in these programs.
Key Takeaways
- Support is holding firm. Favorability for every basic needs program tested remains above 60% — and has ticked upward since 2025 despite sustained attacks on basic needs programs.
- Voters want more funding, not less. 52% want federal funding increased; just 16% want any cuts.
- Attacks on basic needs programs do not justify cuts. Two-thirds of voters are concerned about so-called “fraud” — yet 59% say ensuring programs help everyone who needs assistance is the higher priority, vs. 39% who prioritize fraud prevention.
Finding 1: Support for Basic Needs Programs Is Holding Firm
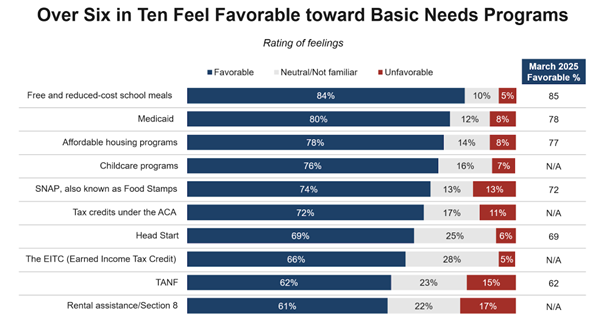
Despite targeted attacks from the administration, favorability for basic needs programs has not eroded — it has trended upward. Medicaid climbed from 78% to 80% favorability. SNAP rose from 72% to 74%. Free and reduced-cost school meals lead at 84% favorable. A full year of attacks on basic needs has not impacted public confidence in these programs.
Key program favorability (March 2026):
- Free and reduced-cost school meals: 84% favorable
- Medicaid: 80% favorable (up from 78% in 2025)
- Affordable housing programs: 78% favorable
- Childcare programs: 76% favorable
- SNAP (Food Stamps): 74% favorable (up from 72% in 2025)
- Head Start: 69% favorable
Finding 2: Voters Want More Funding, Not Less
52% of voters want increased federal funding for basic needs programs, including 21% who want it increased a lot. Just 16% want any reduction. That margin (+36 points) is virtually identical to a year ago (+35), showing the administration’s fraud messaging has made no dent on the belief that basic needs programs should be supported through more funding.
Support for increased funding spans demographics: independents (55%), suburban voters (53%), Latino voters (63%), voters aged 18–34 (62%), non-college-educated voters (55%), and even 48% of low-income Republicans (household incomes under $50,000).
When asked to choose a phrase that best describes these programs, voters reject negative framing by 2-to-1: 64% say basic needs programs are “a good investment for the country,” while just 31% say they’re “full of fraud and a waste of money.” Similarly, 65% say these programs mainly help people who need support.

Finding 3: Attacks Do Not Justify Basic Needs Cuts
A majority, 59%, say the higher priority should be ensuring programs help everyone who needs assistance — versus just 39% who say preventing fraud should be the top priority. That gap holds across every region and every age group. Even among independents, 53% prioritize helping people over fraud prevention. Across all voters, 73% say their biggest worry is that fraud claims will result in cutting support for people who genuinely need and deserve it.

The Bottom Line
A large majority of Americans — across party, age, geography, and income — view basic needs programs favorably, want them funded at higher levels, and reject using fraud claims as justification for cuts. A full year of fraud-focused messaging from the administration has not moved the needle.
We should make it clear who pays the price when programs are gutted: children, seniors, parents, and working families who play by the rules and depend on these programs to meet their most basic needs.
Methodology: Online survey of 1,503 U.S. registered voters matched to the voter file, conducted March 11–16, 2026 by Hart Research Associates for the Partnership for Basic Needs. Credibility interval ±2.53 percentage points for the full sample, with higher tolerances for subgroups.
Subscribe: