Resources from around the Coalition: CHN members weigh in on Census numbers
When the U.S. Census Bureau released its annual reports on income, poverty and health care coverage this week, CHN members were quick to weigh in with their own commentary. You can see a number of their press statements and blog posts (and lots of other resources) on our Census resource page. But meanwhile, here is a sample of what our members are saying.
The Center on Budget and Policy Priorities (CBPP) responded to the Census reports with a news release and two blog posts, which you can see here and here. Like many other groups, CBPP took note of the fact that for the first time since enactment of the Affordable Care Act, the number of uninsured Americans increased – 1.9 million lost health insurance coverage between 2017 and 2018, largely because fewer were covered by Medicaid.
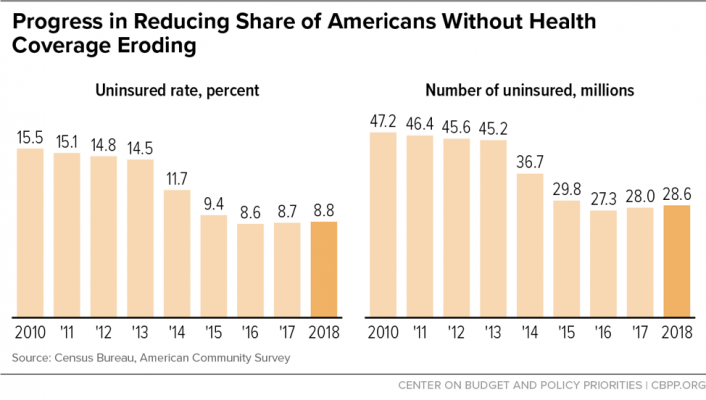
But CBPP went further, explaining the extent to which the Trump Administration is working to sabotage health care – and warning that an additional four million Americans could lose health care coverage in 2019 due mostly to the elimination of the individual mandate.
“Administration efforts to weaken health care coverage provided through the ACA began on President Trump’s first day in office, with an executive order calling on federal agencies to waive and delay ACA provisions ‘to the maximum extent permitted by law,’” CBPP wrote. “These efforts continued as the President and Congress repealed the ACA’s individual mandate (the requirement that most people have coverage or pay a penalty). While repeal did not take effect until 2019, the Congressional Budget Office and other experts concluded that it reduced coverage starting in 2018, by creating confusion among consumers.
“Administration cuts in outreach and enrollment assistance have further reduced ACA marketplace enrollment,” CBPP continued. “Also, the Administration’s support for new state policies that make it harder to enroll or stay enrolled in Medicaid may have contributed to the declines in Medicaid enrollment among children and adults that occurred in 2018.”
The Center for Law and Social Policy (CLASP) focused on the loss of health insurance coverage among children, after decades of improvement. CLASP reported that in 2018, 4.3 million children under the age of 19 were uninsured (5.5 percent), up from 3.9 million (5 percent) in 2017. CLASP, like CBPP, also identified a culprit – the Trump Administration’s “public charge” rule, which takes effect Oct. 15 unless it is stopped in court. “The rule is already having a chilling effect on immigrants who are afraid to use benefits, even for their citizen children who are eligible and not covered by the rule,” CLASP wrote. “The sharp decline found by the Census in children’s health coverage, including a significant increase among Hispanic children, adds to other evidence that the rule is affecting children’s health coverage and poses risks for the nation’s future and our communities’ public health.”
First Focus concentrated on child poverty, and headlined its blog post, “We Know We Can Cut Child Poverty in Half, So Why Aren’t We?” The group used this week’s Census data as a springboard to release its annual Children’s Budget Book, which reports that the share of spending on children in the U.S. declined to an all-time low of just 7.21 percent in the current fiscal year.

And it identified a particularly at-risk population – children in deep poverty, or living below half the federal poverty line (for a mother and child, that would be less than $8,123 a year):
“Despite the vulnerability of children living in households with deep poverty, they often lack access to assistance,” First Focus wrote. “Many anti-poverty programs are contingent upon a household having some income, yet families in deep poverty have little to no earnings due to barriers such as disability, substance abuse, mental health or other complex and persistent issues that prevent them from working full time or at all.”
First Focus warns things could get worse. “Recently, we have also seen a slew of harmful regulations from the Trump Administration that if implemented, would further increase our child poverty rate by restricting access to critical resources for millions of children,” the group wrote.
Community Action Partnership (CAP) noted that many Americans are no better off than in previous years – and in some cases are worse off. “A factor to consider here is that in the past 40 years, real median hourly wages have remained stagnant,” CAP wrote. “In fact, from 1976 to 2016, real wages for the bottom quintile have shrunk by 1 percent. Since 2007, income in households earning $15,000 or less have actually decreased by 1 percent, while households making $250,000 or more saw a 15.7 percent increase.”
The Food Research & Action Center (FRAC) noted that in 2018, SNAP lifted 3.1 million people out of poverty, school lunch lifted 1.3 million out of poverty, and WIC lifted 275,000 out of poverty – estimates that FRAC says might actually be an undercount, as researchers have found that some respondents are reluctant to tell surveyors that they are receiving SNAP or other program benefits. “Federal and state governments need to be doing more to reduce poverty and hunger, not taking steps to erode effective programs,” FRAC wrote. “However, the Trump Administration’s recent proposals to cut people off food assistance could do just that, resulting in millions of people losing their SNAP benefits.”
CHN also commented on the Census numbers, and, like several other groups, pointed out that although the “official” Census measurement showed a significant drop in the nation’s poverty rate, a more accurate measure of poverty showed no one-year decline.
“The Supplemental Poverty Measure, which takes into account housing and other costs as well as counting income from sources such as SNAP/food stamps and low-income tax credits, showed a 13.1 percent poverty rate, higher than the official poverty rate of 11.8 percent,” CHN wrote. “It is telling that the more accurate measure also shows more poverty. Why? Major expenses like rent are growing faster than overall inflation. From 2017 to 2018, rent costs rose by 3.5 percent, while the overall inflation rate was 1.9 percent. This continues a trend from 2013 – 2018; rent rose nearly 20 percent, while inflation as a whole rose 7.8 percent.”
CHN also released a “First Look” early analysis of the Census data; you can see it here.
Keep monitoring CHN’s Census resource page; we’ll be posting all the latest data, our own research, and research, news releases and blog posts from CHN members!
Subscribe: